
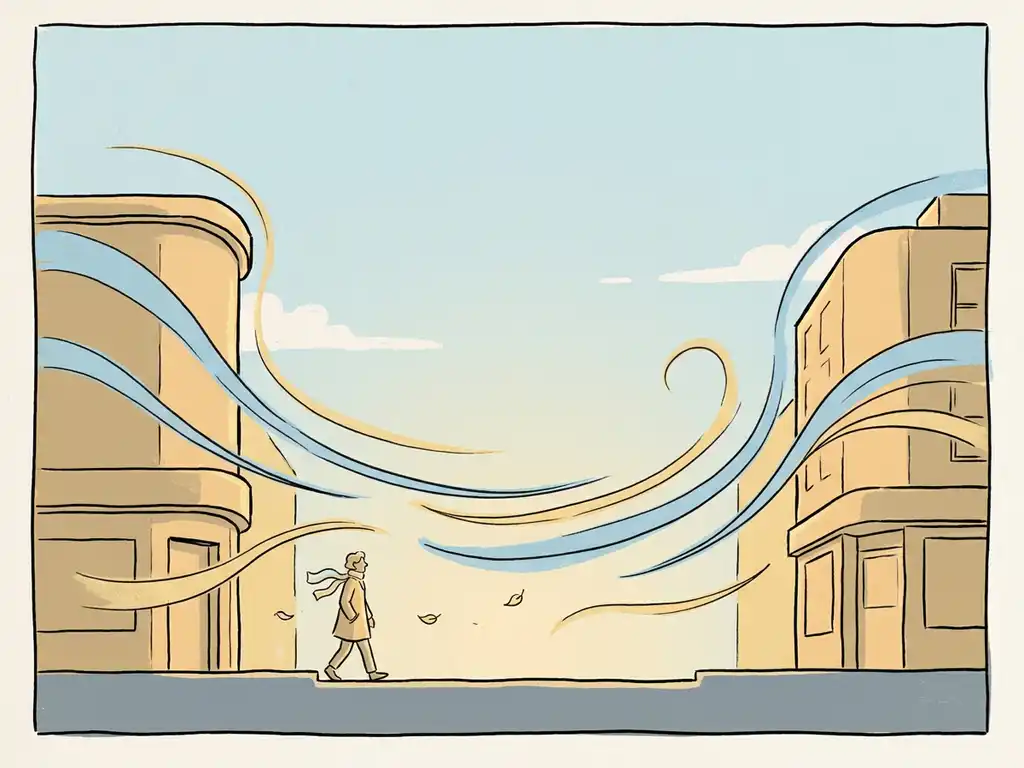
Wind speed affects pedestrian comfort in cities in five main ways: it creates physical discomfort when walking or standing, disrupts everyday activities like cycling or sitting outside, poses direct safety risks at high speeds, reduces the appeal of outdoor spaces, and amplifies the effects of cold temperatures. The threshold at which wind becomes noticeable is around 5 m/s at eye level — above that, comfort drops quickly depending on what you are doing and how exposed the location is. The questions below unpack each of these effects and explain how urban design and wind assessments shape the experience at street level.
At what wind speed does walking become uncomfortable or unsafe?
Walking becomes noticeably uncomfortable when wind speeds at eye level exceed 5 m/s with any regularity. At that point, wind interferes with movement and makes outdoor spaces feel unpleasant. Above 15 m/s, conditions shift from discomfort to genuine danger — wind can destabilise pedestrians, blow over objects, and create hazards that are unacceptable in public spaces.
The Dutch standard NEN 8100 uses the exceedance probability of 5 m/s to classify wind comfort into five classes, from A (excellent) to E (poor). A location where wind exceeds 5 m/s more than 20% of the time falls into class E and is considered unsuitable for any pedestrian activity, including simply passing through. The Lawson criteria, used internationally, apply a similar logic but with slightly different thresholds depending on the intended use of the space.
The type of activity matters a lot. Sitting still on a terrace becomes uncomfortable at lower speeds than brisk walking does. This is why wind engineering assessments always consider the intended function of a space, not just the wind speed in isolation. A plaza designed for sitting needs a stricter comfort class than a through-route.
How does building height and shape influence ground-level wind speeds?
Tall buildings significantly increase ground-level wind speeds by redirecting high-altitude wind downward. A building that is more than twice as tall as its surroundings is particularly likely to cause wind problems at street level, because the velocity difference between the upper atmosphere and the ground is large enough to generate strong downward flows along the facade.
Shape plays an equally important role. A wide, flat facade perpendicular to the prevailing wind acts like a wall that forces air to accelerate around its edges and down its face. Rounded or tapered facades allow wind to flow along the surface rather than being deflected downward, which significantly reduces the acceleration at ground level.
Several geometric rules of thumb are useful here:
- Buildings more than twice the height of their surroundings carry a high risk of creating wind nuisance at street level
- Setbacks (stepped facades) can reduce downward flows, but only if they are at least 5 metres deep for a building of around 100 metres tall
- The ratio of street width to building height (H/W) determines how much wind reaches the ground: below H/W 0.35, most wind reaches the street; above H/W 0.65, most wind is deflected over the roofline
- Gaps and passages through buildings act as pressure shortcuts, accelerating wind significantly — these should be avoided or made as narrow as possible
Clustering tall buildings so they shield each other — sometimes called the Manhattan effect — is one of the more effective strategies at urban scale. The Wijnhaveneiland area in Rotterdam is a good example: careful clustering and strategic setbacks result in almost entirely class A wind conditions despite significant building heights.
What is the difference between wind comfort and wind safety for pedestrians?
Wind comfort refers to whether wind conditions allow people to use a space pleasantly for a given activity. Wind safety refers to whether wind speeds create a physical danger — the risk of being knocked over, injured by flying objects, or losing control of a vehicle. They are measured separately and have different thresholds.
Under NEN 8100, wind comfort is assessed by looking at how often wind speeds exceed 5 m/s at eye height (1.75 m). Wind safety is assessed separately by looking at how often speeds exceed 15 m/s. An exceedance probability of 0.05% to 0.30% at 15 m/s is classified as limited risk and may be acceptable depending on the location. Above 0.30%, conditions are considered dangerous and unacceptable in any public space.
In practice, a location can have poor comfort ratings without posing a safety risk — and in rare cases, a location with acceptable average comfort can still have dangerous peak conditions. This is why both dimensions are always assessed together in a proper wind study, rather than treating comfort as a proxy for safety.
Which urban spaces are most exposed to high wind speeds?
The urban spaces most exposed to high wind speeds are those near tall, isolated buildings, on exposed bridges, at the corners of large building blocks, and in open plazas where more than 25% of the windward facade is open. Waterfronts are also consistently windier than inland areas because wind travels over water without friction.
Research from a large-scale wind study covering a 5-kilometre diameter area of Rotterdam illustrates this clearly. Wind nuisance hotspots included:
- Isolated tall buildings such as the Maastoren and buildings around Kop van Zuid and Rotterdam Centraal
- Exposed bridges including the Erasmusbrug and parts of the Willemsbrug, where wind travels unobstructed over the river
- The Lloydpier area, where buildings reach only 70 metres but southwesterly wind sweeps in unhindered over low industrial buildings and open water
Streets oriented parallel to the prevailing wind direction are also vulnerable — they act as channels that funnel and accelerate airflow. Orienting streets perpendicular or diagonally to the dominant wind direction helps prevent this. Open plazas without shelter on the windward side consistently show the worst comfort ratings, particularly when they face southwest in the Dutch context, where the dominant wind direction is southwest.
How do wind assessments measure and predict pedestrian wind conditions?
Wind assessments use two main methods: physical wind tunnel testing and CFD (Computational Fluid Dynamics) simulation. Both methods calculate wind speeds at pedestrian height across a site and express the results as comfort or safety classifications. CFD is the standard approach for large or complex urban areas because it can model entire city districts without the physical constraints of a wind tunnel.
A CFD wind assessment typically works in three stages. First, a detailed 3D model of the area is built from geodata, including existing and permitted buildings. Second, a computational mesh divides the air volume around and between buildings into millions of cells — a city-scale study can involve more than 500 million cells. Third, simulations are run for multiple wind directions using meteorological data, and the raw output is processed into colour-coded maps that show comfort and safety classifications across the entire area.
The meteorological input comes from datasets like the KNMI’s NPR 6097 (legally required for Dutch permit procedures) or the more recent DOWA offshore wind atlas. Both datasets produce comparable wind roses, confirming that the strongest and most frequent winds in the Netherlands come from the southwest.
Our team at Actiflow uses advanced CFD simulations to produce colour-coded maps and visualisations that translate complex airflow data into output you can present directly to planners, clients, or permit authorities. For large-scale assessments, we use OpenFOAM with SST k-omega turbulence modelling — the same approach used in our Rotterdam city-wide pilot study.
What design measures can reduce wind nuisance in city spaces?
The most effective design measures for reducing wind nuisance work at the urban planning level first, then at building level, and finally in the immediate surroundings. Solving wind problems after the building layout is fixed is significantly harder and more expensive than addressing them during the design phase.
At urban planning level:
- Cluster tall buildings so they shield each other, keeping height differences between neighbouring buildings below 30%
- Orient streets perpendicular or diagonally to the prevailing wind, not parallel
- Keep open plaza facades on the windward side below 25% openness
At building level:
- Use setbacks of at least 5 metres depth to interrupt downward flows on tall facades
- Design rounded or tapered facades to guide wind along the surface rather than downward
- Avoid ground-level passages aligned with the dominant wind direction
- Canopies offer limited protection — they shift the problem to the canopy edge rather than eliminating it
At street level:
- Vegetation such as trees and hedges improves comfort but is not sufficient as a primary safety measure, and loses effectiveness in winter when wind speeds are highest
- Wind screens redirect local airflow but create acceleration at their edges and can affect the feel of a space
- Sunken seating areas and raised edges in paving can create sheltered zones without large structures
- Relocating sensitive functions — terraces, playgrounds, entrances — away from the windiest spots is often the simplest and cheapest fix
An important principle: a minimum wind speed of around 2 m/s is needed for effective ventilation of heat and air pollutants in urban streets. Reducing wind too aggressively in dense areas can create stagnant pockets with poor air quality. Good wind design always balances comfort against ventilation, which is why a building physics perspective is valuable alongside a comfort assessment.
How Actiflow helps with pedestrian wind comfort in cities
We have been carrying out wind assessments for buildings, area developments, and urban masterplans since 2005 — founded as a spin-off of Delft University of Technology, with over 21 years of experience in fluid dynamics. Our work spans individual high-rise buildings to city-wide studies like the one we completed for the municipality of Rotterdam, which covered a 5-kilometre diameter area and involved more than 580 million mesh cells.
Here is what working with us looks like in practice:
- We advise you on which assessment method applies to your project — NEN 8100 for Dutch permit procedures, Lawson criteria for international projects in the UK, Gibraltar, or elsewhere
- We build detailed CFD models from geodata and run simulations across all relevant wind directions and seasons
- We deliver colour-coded comfort and safety maps that you can share directly with clients, planners, or permit authorities — no translation needed
- We flag wind problems early enough in the design process to address them with targeted adjustments rather than costly redesigns
- We stay close to your project from intake to final report, with a single point of contact throughout
- For regular clients, we can start the next day — speed and flexibility are part of how we work
You can find more about our approach and the range of projects we work on at actiflow.com.
Curious how we can help with pedestrian wind comfort in your project? Feel free to contact us. We would be happy to discuss your project and help you find the right engineering solution. You can also find out more about who we are and how we work on our about us page.
