
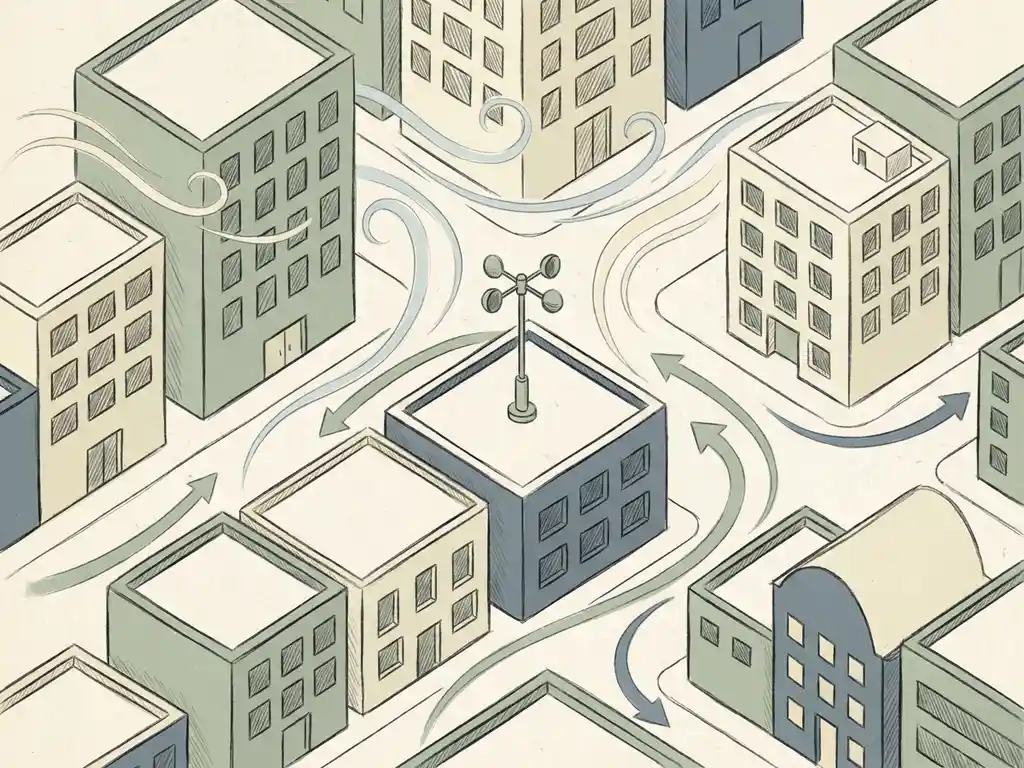
Wind speed around urban buildings is measured using two main methods: physical wind tunnel testing and CFD (Computational Fluid Dynamics) simulation. Both approaches measure wind velocity at pedestrian height, typically 1.75 metres above ground level, and produce results that can be assessed against recognised standards such as NEN 8100 (used in the Netherlands) or the Lawson criteria (used internationally). The sections below explain how each method works, what data you need to get started, and which standard applies to your project.
What methods are used to measure wind speed around buildings?
Wind speed around buildings is measured using two established methods: wind tunnel testing, where a physical scale model is placed in a controlled airflow environment, and CFD simulation, where airflow is calculated digitally using computational models. Both methods measure wind velocity at pedestrian level and produce results that can be classified against wind comfort and safety standards. The right method depends on the scale of your project and the level of detail required.
Wind tunnel testing has been the traditional approach for decades. You build a scaled physical model of the building and its surroundings, place it in a wind tunnel, and measure airflow at various points using pressure sensors or tracer techniques. It works well for individual buildings and smaller masterplans.
CFD simulation takes a different route entirely. Instead of a physical model, engineers build a detailed 3D digital model of the urban environment and solve the equations governing airflow computationally. This makes it particularly suited to large-scale or complex urban areas where building a physical model would be impractical or impossible.
In practice, both methods are reliable and accepted by regulators. The choice between them comes down to project scope, budget, and timeline — topics covered in more detail below.
How does a wind tunnel test measure urban wind conditions?
A wind tunnel test measures urban wind conditions by placing a scaled physical model of a building and its surroundings inside a controlled airflow chamber. Sensors positioned at key locations — particularly at pedestrian height — record wind speed and pressure under different wind directions. The results are then scaled back up to real-world conditions and assessed against comfort and safety criteria.
The physical model typically includes the target building and everything within a meaningful radius around it, because neighbouring buildings, streets, and open spaces all influence how wind behaves at ground level. Pressure taps, hot-wire anemometers, or particle image velocimetry techniques capture the airflow data at multiple measurement points simultaneously.
Wind tunnel testing gives you a direct, tangible measurement of airflow behaviour. It is particularly useful when you need high spatial resolution around a specific building or when the geometry is complex enough that you want physical validation. For smaller masterplans and individual high-rise assessments, it remains a strong and well-accepted approach.
How does CFD simulation measure wind speeds in urban environments?
CFD simulation measures wind speeds in urban environments by dividing the air volume above and between buildings into millions of small computational cells and solving the equations of fluid motion across each one. The result is a detailed, three-dimensional picture of how wind moves through the urban environment under different conditions.
The process follows three main steps:
- 3D model construction: A digital model is built from geodata sources, incorporating existing and approved buildings. Details smaller than roughly one metre are typically omitted because they have negligible effect on results at urban scale.
- Mesh generation: The air volume is divided into computational cells. Cell sizes vary — finer near building surfaces and street level where accuracy matters most, coarser further away. For a large urban study, this mesh can contain hundreds of millions of cells.
- Post-processing: Raw simulation results are converted into maps and visualisations. These typically include colour-coded wind speed maps at pedestrian height, showing which areas exceed comfort or safety thresholds under different wind directions.
The meteorological input for CFD simulations comes from wind datasets such as the NPR 6097 dataset (legally required for NEN 8100 permit procedures in the Netherlands) or the DOWA (Dutch Offshore Wind Atlas), which offers more recent data with seasonal breakdowns. Both datasets produce comparable wind roses, with the dominant wind direction clearly from the southwest in the Netherlands.
CFD is particularly powerful for large-scale wind engineering projects where a physical wind tunnel model would be impractical. A city-wide study, for example, requires a computational domain of several kilometres in diameter — something no wind tunnel can accommodate.
What is the difference between wind tunnel testing and CFD for buildings?
The main difference between wind tunnel testing and CFD for buildings is that wind tunnel testing uses a physical scale model in a controlled airflow environment, while CFD uses computational simulation to calculate airflow digitally. Both methods are accepted by regulators and produce comparable results, but they suit different project types and scales.
| Aspect | Wind tunnel testing | CFD simulation |
|---|---|---|
| Model type | Physical scale model | Digital 3D model |
| Best suited for | Individual buildings, smaller masterplans | Large urban areas, city-wide studies |
| Design iteration | Requires physical model changes | Fast to update digitally |
| Spatial coverage | Limited by tunnel size | Scalable to any area |
| Output | Measured data at sensor points | Colour-coded maps across entire domain |
For most urban building projects today, CFD has become the preferred method — especially when the project involves multiple buildings, a complex street layout, or an area development where design changes are still likely. Wind tunnel testing remains valuable when you want physical validation or when the project involves a single complex structure where very high spatial resolution is needed at specific points.
What wind speed data is needed before a building assessment can start?
Before a building wind assessment can start, you need meteorological wind data for the project location — specifically a wind rose showing wind speed frequencies and directions across a full year. You also need a 3D model of the building and its surroundings, including neighbouring structures within a meaningful radius, typically at least 500 metres around the site.
The key inputs for a typical urban wind assessment are:
- Wind climate data: A dataset showing how often wind blows from each direction and at what speed. In the Netherlands, the NPR 6097 dataset (covering 1963 to 2002) is legally required for NEN 8100 permit procedures. The DOWA dataset (2008 to 2017) is more recent and allows seasonal breakdowns, making it useful for comfort-focused studies.
- 3D building geometry: The target building and surrounding structures, typically sourced from geodata such as BRT TOP10NL, 3DBAG, or AHN in the Netherlands. Planned or approved buildings in the area should also be included.
- Site context: Information about the intended use of outdoor spaces — whether an area is meant for sitting, walking, or passing through affects how wind comfort results are interpreted and what mitigation measures might be needed.
The more complete your input data at the start, the more reliable and actionable your results will be. Wind studies that begin with incomplete building geometry or outdated wind data often need to be revised later, which costs time and money. Starting with a full-service fluid dynamics consultancy that handles data sourcing as part of the process saves significant effort on the client side.
Which wind assessment standard applies to your building project?
The wind assessment standard that applies to your project depends on where it is located. In the Netherlands, NEN 8100 is the legally required standard for permit applications. For projects in the UK and most other international contexts, the Lawson criteria apply. Both standards assess pedestrian wind comfort at eye height (1.75 metres), but they use different classification systems and thresholds.
Under NEN 8100, wind discomfort is measured as the probability that wind speed exceeds 5 m/s at pedestrian height. Results are classified into five categories:
- Class A: Exceedance probability below 2.5% — suitable for sitting, strolling, and walking through
- Class B: 2.5 to 5% — suitable for strolling and walking through
- Class C: 5 to 10% — suitable for walking through only
- Class D: 10 to 20% — marginal for all activities
- Class E: Above 20% — unsuitable for all activities
Wind danger (as distinct from wind discomfort) is assessed separately under NEN 8100, using the probability that wind speed exceeds 15 m/s. An exceedance probability above 0.30% is considered unacceptable.
The Lawson criteria follow a similar logic but use a different set of activity categories and thresholds, making direct comparison between the two systems difficult. If your project spans multiple countries or involves an international client, it is worth clarifying upfront which standard the permit authority expects — and whether both need to be addressed.
How Actiflow helps with wind speed measurement around buildings
We have been carrying out wind assessments since 2005, working with architects, developers, structural engineers, and municipalities across the Netherlands, Belgium, the UK, Gibraltar, and beyond. Whether your project needs a NEN 8100 assessment for a Dutch permit application or a Lawson-based study for an international development, we know which standard applies and what the relevant authority expects.
Here is what working with us looks like in practice:
- We advise you from the start on which assessment method and standard applies to your specific situation
- We handle data sourcing — wind climate datasets, 3D building geometry, and surrounding context — so you do not have to
- We run CFD simulations using advanced virtual wind tunnel technology, producing colour-coded maps and graphics that you can present directly to clients, planners, or permit authorities
- We cover the full scale range, from single high-rise assessments to city-wide studies like the comprehensive wind analysis we carried out for the city of Rotterdam
- We are known for fast turnaround — for regular clients, we can start the next day if the project requires it
- You have a single point of contact from intake to final report
Curious how we can help with wind speed measurement around your building project? Contact us — we would be happy to discuss your project and help you find the right engineering solution. You can also learn more about our team and background on our about us page.
