
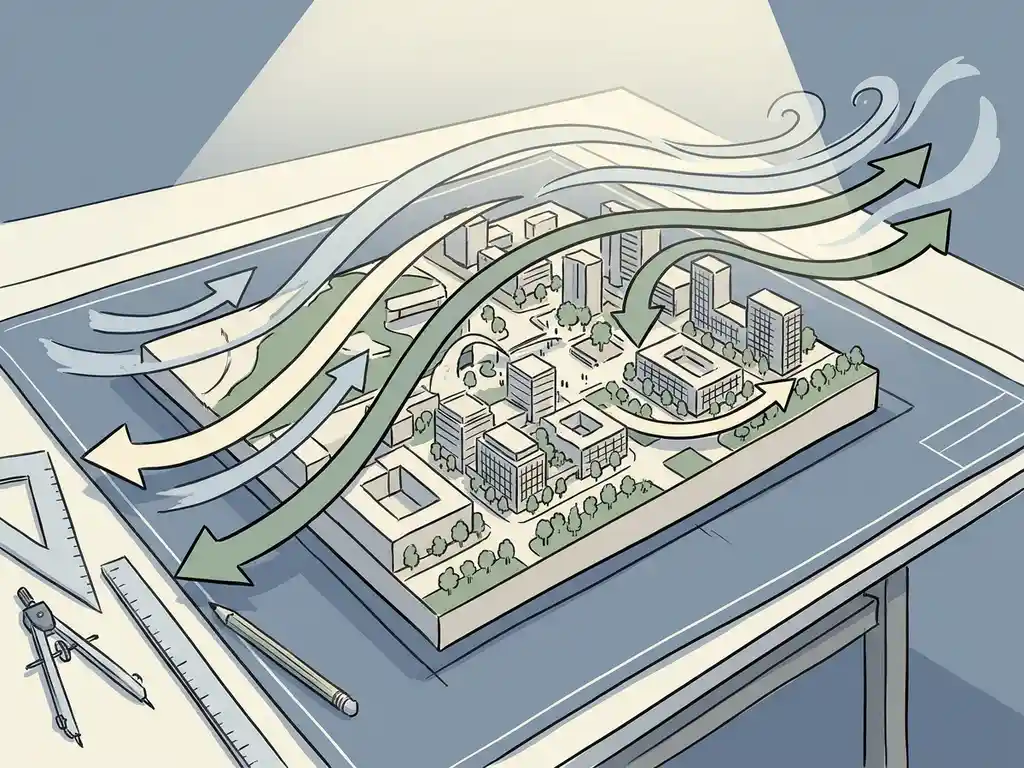
Engineers assess wind speed around a new development using two main methods: physical wind tunnel testing and CFD (Computational Fluid Dynamics) simulation. Both methods measure how wind behaves at pedestrian level and on building surfaces, then compare those results against accepted comfort and safety criteria such as NEN 8100 or the Lawson criteria. The sections below walk through each step of the process, from the data you need to collect upfront to what happens when the results flag a problem.
What methods do engineers use to measure wind around buildings?
Engineers use two proven methods to assess wind speed around buildings: wind tunnel testing and CFD simulation. Wind tunnel testing involves building a physical scale model and exposing it to controlled airflow. CFD simulation recreates the same physics digitally, using a computer model of the site and its surroundings. Both methods are reliable; the right choice depends on the scale and nature of the project.
For individual buildings or smaller masterplans, a wind tunnel test works well. You build a detailed physical model, place it in the tunnel, and measure airflow at dozens of points around the base of the structure. It is a direct, hands-on approach that many engineers trust for facade pressure testing and structural load calculations.
For large urban areas, wind tunnel testing becomes impractical. You cannot fit an entire city district into a tunnel at a meaningful scale. That is where CFD takes over. A CFD simulation models the full three-dimensional geometry of a neighbourhood, runs the airflow calculations across millions of computational cells, and produces results across the entire area in a single run. For city-wide or district-level studies, CFD is the only realistic option.
Some projects use both methods together: CFD to understand the broader area, and wind tunnel testing to validate specific pressure loads on a building’s facade.
What wind data is needed before an assessment can begin?
Before an assessment can begin, engineers need local meteorological wind data and a detailed 3D model of the site and its surroundings. The wind data defines how often wind blows from each direction and at what speed. The 3D model tells the simulation exactly what the wind is flowing around. Without both, results will not be reliable.
In the Netherlands, the standard meteorological dataset for permit-related assessments is NPR 6097, which covers the period 1963 to 2002 and is legally required for NEN 8100 procedures. A more recent dataset, DOWA (Dutch Offshore Wind Atlas, 2008 to 2017), is also used and offers higher spatial resolution and seasonal breakdown. Both datasets produce comparable wind roses, with the dominant wind direction clearly from the southwest.
On the geometry side, engineers typically build their 3D model using publicly available geodata: datasets such as BRT TOP10NL, 3DBAG, and AHN for the Netherlands. Existing and permitted buildings are included in the model. Details smaller than roughly one metre are left out, because they have a negligible influence on pedestrian-level wind speeds. Vegetation is only included where it forms larger clusters. A buffer zone of around 250 metres surrounds the core area to ensure wind enters the model correctly.
How does CFD simulation model wind flow around a development?
A CFD simulation models wind flow by dividing the air volume above and between buildings into millions of small cells, then solving the physics of airflow across all of them simultaneously. The simulation runs for multiple wind directions and produces a detailed picture of wind speed at pedestrian height across the entire site.
The process runs in three clear steps:
- 3D model construction: The site geometry is built from geodata. All relevant buildings, existing and planned, are included. The model extends well beyond the core development to ensure realistic inflow conditions.
- Mesh generation: The air volume is divided into a computational mesh. Cell sizes are smallest near the ground and building surfaces (as fine as 0.25 metres) and grow toward the edges of the domain (up to 64 metres). Near wall surfaces, prismatic cell layers capture the velocity gradient in the atmospheric boundary layer. A large urban study can involve hundreds of millions of cells.
- Simulation and post-processing: The solver calculates wind speed and pressure across all cells for each wind direction. Raw results are then processed into maps and visualisations that show wind conditions at pedestrian level.
The software most commonly used for this type of work is OpenFOAM, running a steady-state solver with an SST k-omega turbulence model. The atmospheric boundary layer follows a logarithmic profile in line with NPR 6097. For a large-scale urban study, the computing time alone can run to hundreds of CPU-hours across thousands of processor cores. Our work on a city-wide wind engineering study for Rotterdam involved a mesh of over 583 million cells, roughly 20 to 30 times larger than a typical single-building assessment.
What criteria do engineers use to judge whether wind speeds are acceptable?
Engineers judge wind speeds against established comfort and safety criteria. In the Netherlands, the standard is NEN 8100, which classifies wind conditions based on how often wind speeds exceed 5 m/s at eye height (1.75 metres). Internationally, the Lawson criteria serve the same purpose. Both frameworks link wind frequency to the type of activity taking place at a location.
The NEN 8100 classification runs from Class A (best) to Class E (worst):
- Class A: Wind exceeds 5 m/s less than 2.5% of the time. Suitable for sitting, strolling, or walking through.
- Class B: Exceedance between 2.5% and 5%. Still acceptable for most activities.
- Class C: Exceedance between 5% and 10%. Acceptable for walking through, less so for sitting.
- Class D: Exceedance between 10% and 20%. Problematic for most uses.
- Class E: Exceedance above 20%. Poor conditions for any outdoor activity.
Beyond comfort, NEN 8100 also defines a wind hazard threshold. If wind speeds exceed 15 m/s at eye height more than 0.3% of the time, the location is classified as dangerous. That classification is not negotiable: it signals an unacceptable safety risk that must be addressed before a permit can be granted.
For projects outside the Netherlands, particularly in the UK, the Lawson criteria apply the same logic but use slightly different thresholds and activity categories. Knowing which standard applies to your project is worth confirming early, as it affects both the methodology and the format of the final report. You can find a broader overview of how these assessments fit into the design process on the Actiflow website.
What does the output of a wind assessment actually look like?
The output of a wind assessment is typically a set of colour-coded maps showing wind conditions across the site at pedestrian level, accompanied by a written report that explains the findings and their implications for the design or permit application. The maps are the most directly useful part: they show at a glance where conditions are comfortable and where problems exist.
Each map is tied to a specific activity type (sitting, strolling, walking through) and uses a colour scale that corresponds to the NEN 8100 or Lawson classification. Green areas meet the target. Orange and red areas signal conditions that need attention. This visual format makes it straightforward to share results with architects, developers, or permit authorities, without requiring the audience to interpret raw data.
Beyond the comfort maps, a full assessment typically includes:
- Wind hazard maps showing locations where the 15 m/s threshold is at risk of being exceeded
- Wind rose diagrams showing the dominant wind directions and frequencies
- Specific point measurements at locations of interest, such as building entrances, terraces, or public squares
- A written analysis explaining which areas meet the criteria and which do not, with reference to the applicable standard
The best outputs are decided collaboratively. When engineers, designers, and planners agree upfront on which questions the assessment needs to answer, a single simulation run can produce multiple thematic maps that each serve a different purpose.
What happens when wind assessment results show a hazard?
When results show a wind hazard, engineers work through a structured hierarchy of design interventions, starting at the urban planning level and working down to smaller-scale measures. The earlier in the design process the problem is identified, the easier and cheaper it is to fix. Changes to building volume and orientation are far more effective than adding screens or canopies after the fact.
The mitigation hierarchy works like this:
- Urban layout: Adjust building heights so adjacent buildings differ by no more than 30%. Cluster towers so they shelter each other (the so-called Manhattan effect). Orient streets at an angle to the prevailing wind to avoid channelling effects. A building more than twice the height of its surroundings is a reliable predictor of wind problems at street level.
- Building volume and orientation: Avoid presenting the widest facade perpendicular to the prevailing wind. Use setbacks: recessing upper floors reduces downwash to street level. A setback needs to be at least 5 metres deep for a building of around 100 metres to be effective. Note that the setback roof level itself tends to sit in a downward airstream and is not suitable as usable outdoor space.
- Architectural detailing: Rounded or tapered facades let wind flow around the building rather than straight down. Covered walkways protect pedestrians directly, provided they are deep enough. Screens redirect local airflow but can accelerate wind at their edges.
- Public space adjustments: Lowered seating areas, raised kerbs, and strategic planting (trees, hedges) can improve comfort at specific spots. These are last-resort measures, not substitutes for getting the building design right.
One important principle: if wind issues are only discovered after the building design is fixed, the options narrow significantly. A terrace that sits in a permanent downwash zone can be screened, but it cannot easily be moved. That is why running at least a quick-scan assessment during the early design phase, before layouts are locked in, is always worthwhile.
How Actiflow helps you assess wind speed around a development
We have been carrying out wind assessments since 2005, working with municipalities, real estate developers, architects, and structural engineers across the Netherlands, Belgium, the UK, Gibraltar, and beyond. Whether you need a quick-scan CFD assessment to validate an early-stage design or a full NEN 8100 or Lawson-compliant report for a permit application, we cover the full range.
Here is what working with us looks like in practice:
- We advise you on which type of assessment fits your project and which standard applies, so you do not waste time commissioning the wrong study
- We run CFD simulations using validated software and produce colour-coded maps that you can submit directly to municipalities or share with clients
- We have experience across scales, from single high-rise assessments to city-wide studies such as the one we carried out for the city of Rotterdam
- For projects outside the Netherlands, we apply the Lawson criteria and are familiar with UK planning requirements
- We move fast: for regular clients, we set everything aside to start the next day if needed, and our internal automation keeps delivery times short
- You get one point of contact who stays close to the project from the first intake conversation to the final report
Curious how we can help with your wind speed assessment? Contact us and we will be happy to discuss your project and help you find the right approach. You can also find out more about our team and background on our about us page.
